 As we’ve touched on so far in our series on Energy Optimization, electrifying our built environment requires innovation in policy frameworks, finance mechanisms, and customer inspiration. A critical component to our success, though, lies in the details—how we are measuring energy savings and energy usage in our buildings. This leads us to our fourth Energy Optimization pivot, which is expanding what are called meter-based savings.
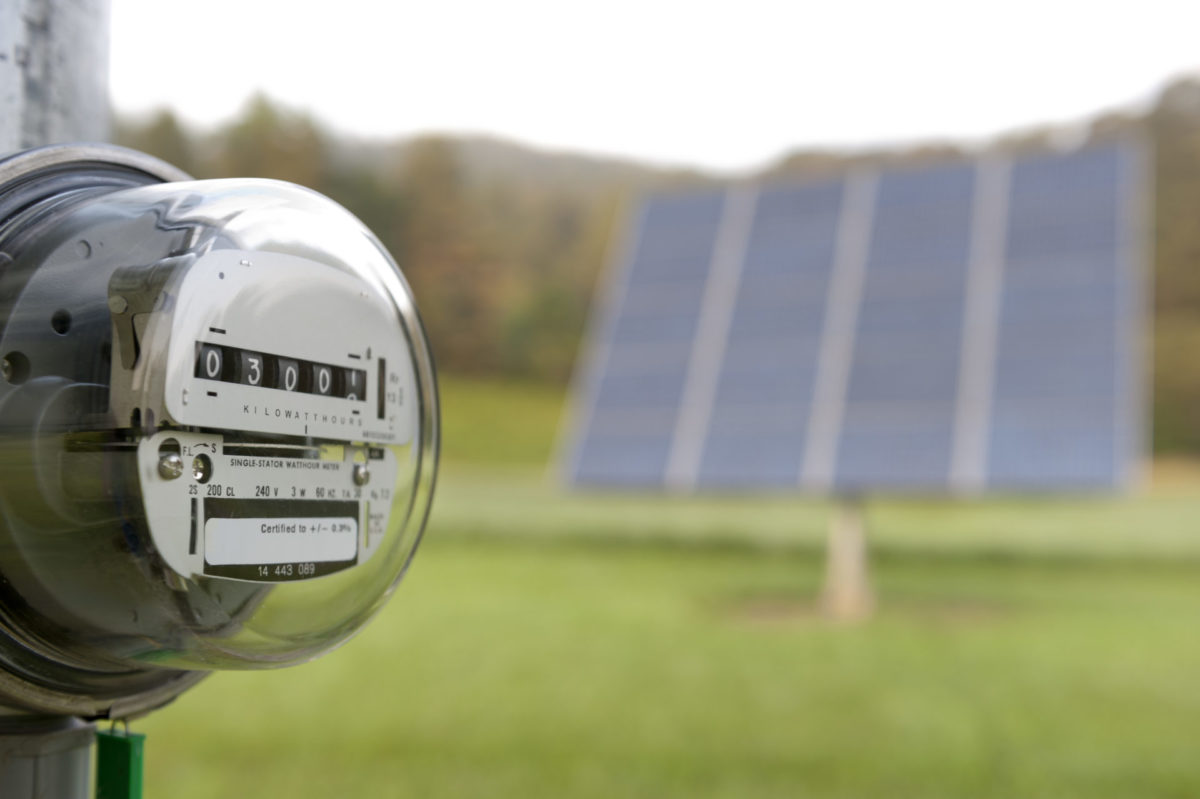
We wrote in our last post about the importance of smart meters. Most of the meters deployed in homes and buildings across the U.S. are “smart”—recording your home’s energy usage data and sending it back to the utility in shorter time intervals, usually sub-hourly. However, despite those capabilities, that data is not always well integrated into how utilities and regulators are forecasting our energy use.
In fact, most utilities and regulators still use what are called “deemed savings”—an estimate of energy usage. Deemed savings generate an informed average of energy savings that will be achieved by certain measures (installation of a new appliance, for example) in a home or building. This process is time-intensive and expensive, and the outcomes are often disconnected from what shows up at the meter—particularly when we already have data from smart meters, and should make use of our ability to process data quickly and inexpensively. Switching from deemed savings to savings measured at the meter dramatically improves accuracy.
Perhaps more importantly, though, a switch to using meter-based savings for energy efficiency and optimization programs has important carbon implications. Here’s why.
Many of us are familiar with the California Duck Curve, the chart indicating the rise and fall of energy demand and supply over the course of a day, and the effects that huge surpluses of solar energy generation mid-day have had on creating morning and evening peaks on the California grid at the “shoulder” periods. And now there is also the Midwest Gator curve, the Texas Armadillo curve, and so on—all of which simply indicate that renewable generation is variable, and we need a suite of distributed energy resources (DERs) to address generation and load variability on our grid as it gets increasingly complicated to balance. As we integrate more renewable energy, our power generation curve changes; simultaneously, as we electrify our transportation and buildings, we’ll see new load added to the grid. It will be increasingly important that we position our new load (transportation charging infrastructure, our building stock) to react flexibly, and quickly, to grid variability. That way we can pre-program our electric vehicle chargers to charge, or pre-set our air conditioning to cool our homes, at the most optimal time from both a cost and carbon standpoint, e.g., at a time of day when there’s a solar or wind surplus, as opposed to when we may be drawing power from fossil fuel peaker plants.
By relying on the meter as the basis for how utilities’ energy efficiency and energy optimization programs are run, we create the opportunity to convert buildings into energy system assets that can be managed in this way. Utilities and regulators can see specifically when and where energy is being used, and building owners and managers can shape energy usage in response to certain price signals—increasing cost savings and, if financially incented to do so, maximize carbon benefit.
As more accurate information is gathered over time, grid planners can also use this data from the meter to better inform their load forecasting—their estimates of how much energy will be needed at any given time to serve a population. They can then reduce the expected load during peak periods on the grid in accordance with real numbers, including during times where fossil fuels are operating. The graph below shows the enormous variance in carbon savings potential between a meter-based savings program (this one shows the variance between California utility PG&E’s Advanced Home Upgrade Program [AHUP]) and a commercial deemed savings program
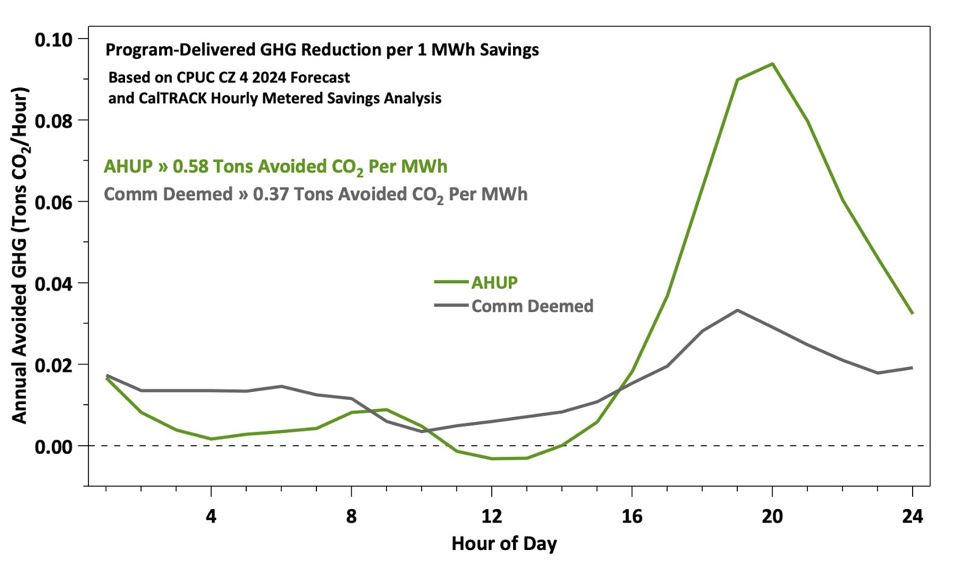 Above: Accrued greenhouse gas emissions from 1 megawatt hour of savings through the AHUP and Commercial Deemed programs.
A switch to meter-based savings also encourages a much higher degree of confidence in the data, both for regulators to incorporate into their decision-making—changing the load forecast for a power grid, for example—and also among private investors. Dependable, timely, and clear data on energy demand and usage reduces the risk in energy optimization investments. It also allows us to think about ways energy optimization can be sold through more familiar financial instruments, such as the popular solar Power Purchase Agreement (PPA) structure. PPA structures for EO are already being piloted in the U.S., including by Seattle City Light, which has announced the expansion of its “Energy Efficiency as a Service (EEAS)” pilot, procuring energy efficiency contracts at about 8 cents per kilowatt hour for up to 20-year contracts.
New York is one state leading the charge on re-evaluating how we to drive efficiency measures in existing buildings through its Reforming the Energy Vision (REV) process. The New York State Energy Research and Development Authority (NYSERDA) is utilizing a meter-based savings framework to measure energy optimization programs and measures. Energy-saving measures are directly compared with, and considered in parallel with, other distributed energy resources investments, such as rooftop solar or battery storage.
Overall, bringing savings measurement forward to the meter unlocks new markets for saving more energy and better. Next in our blog series on energy optimization: We share our perspective on a new report on equitable electrification.